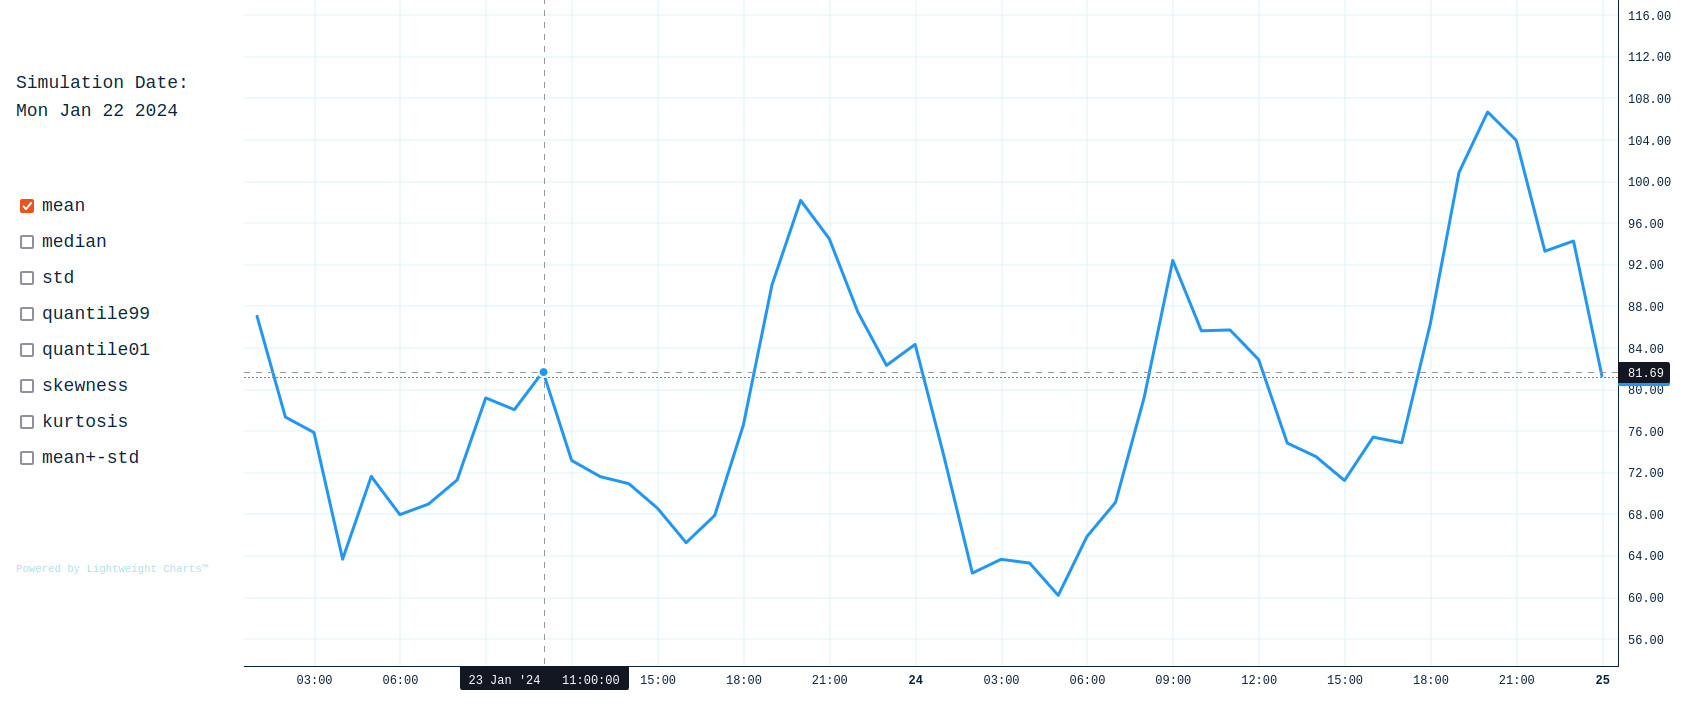
Predictions of the hourly spot prices for the next 48 hours through 10 000 simulations of every hour
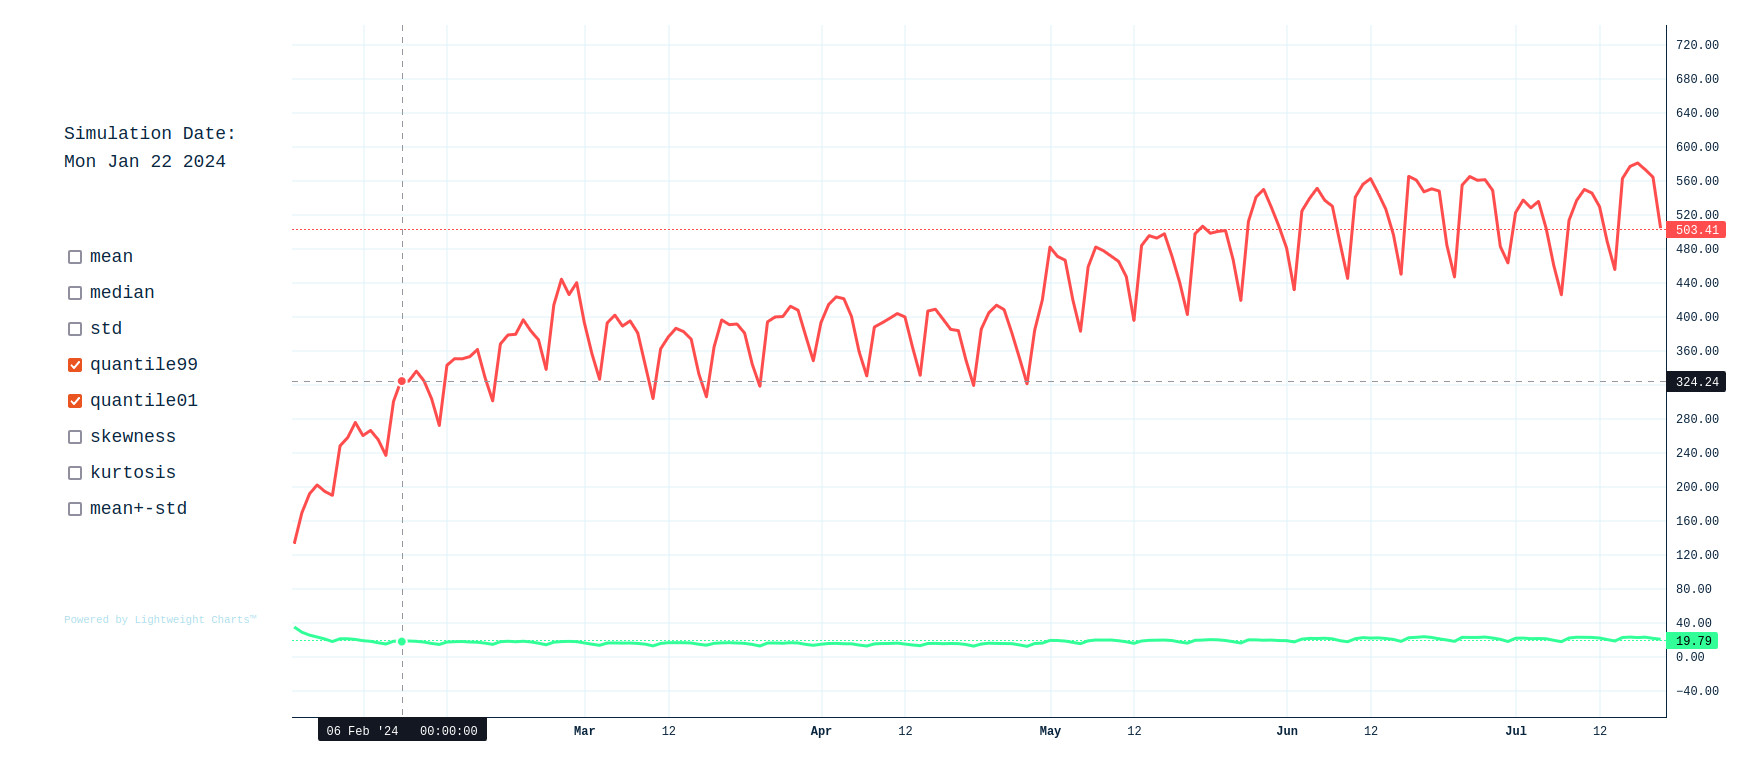
Predictions of the daily average spot price for the next 180 days through 10 000 simulations of every day
An API that provides access to full simulation data with all 10 000 samples for every predicted price of both models
A dashboard webapp with daily updated charts with core statistics for every predicted price of both models
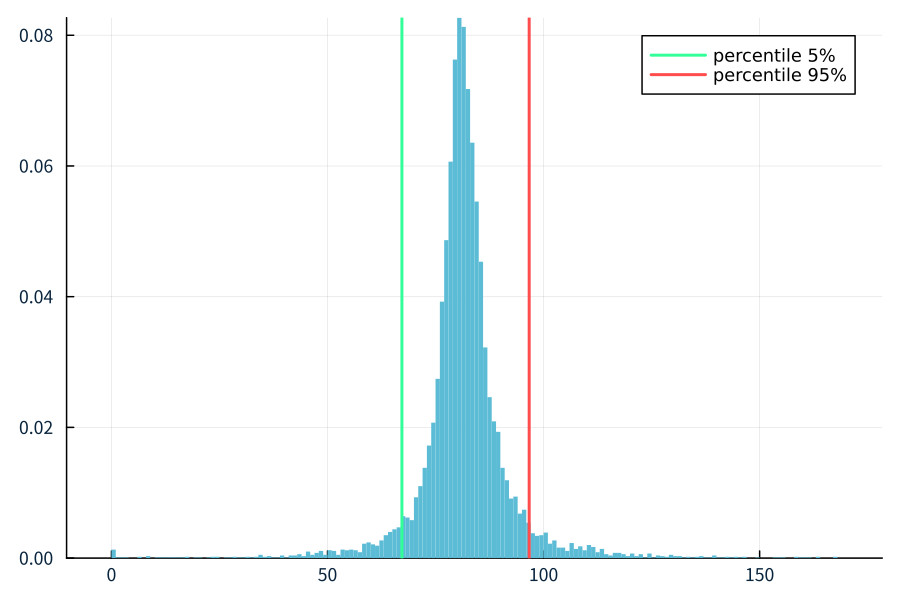
ESPF API provides you the data to build the probability distribution of the prices for the next 48 hours, as well as the average daily prices for the next 180 days. Using this data, you're able to drive your decision plan with quantitative arguments to design the best strategies in advance.
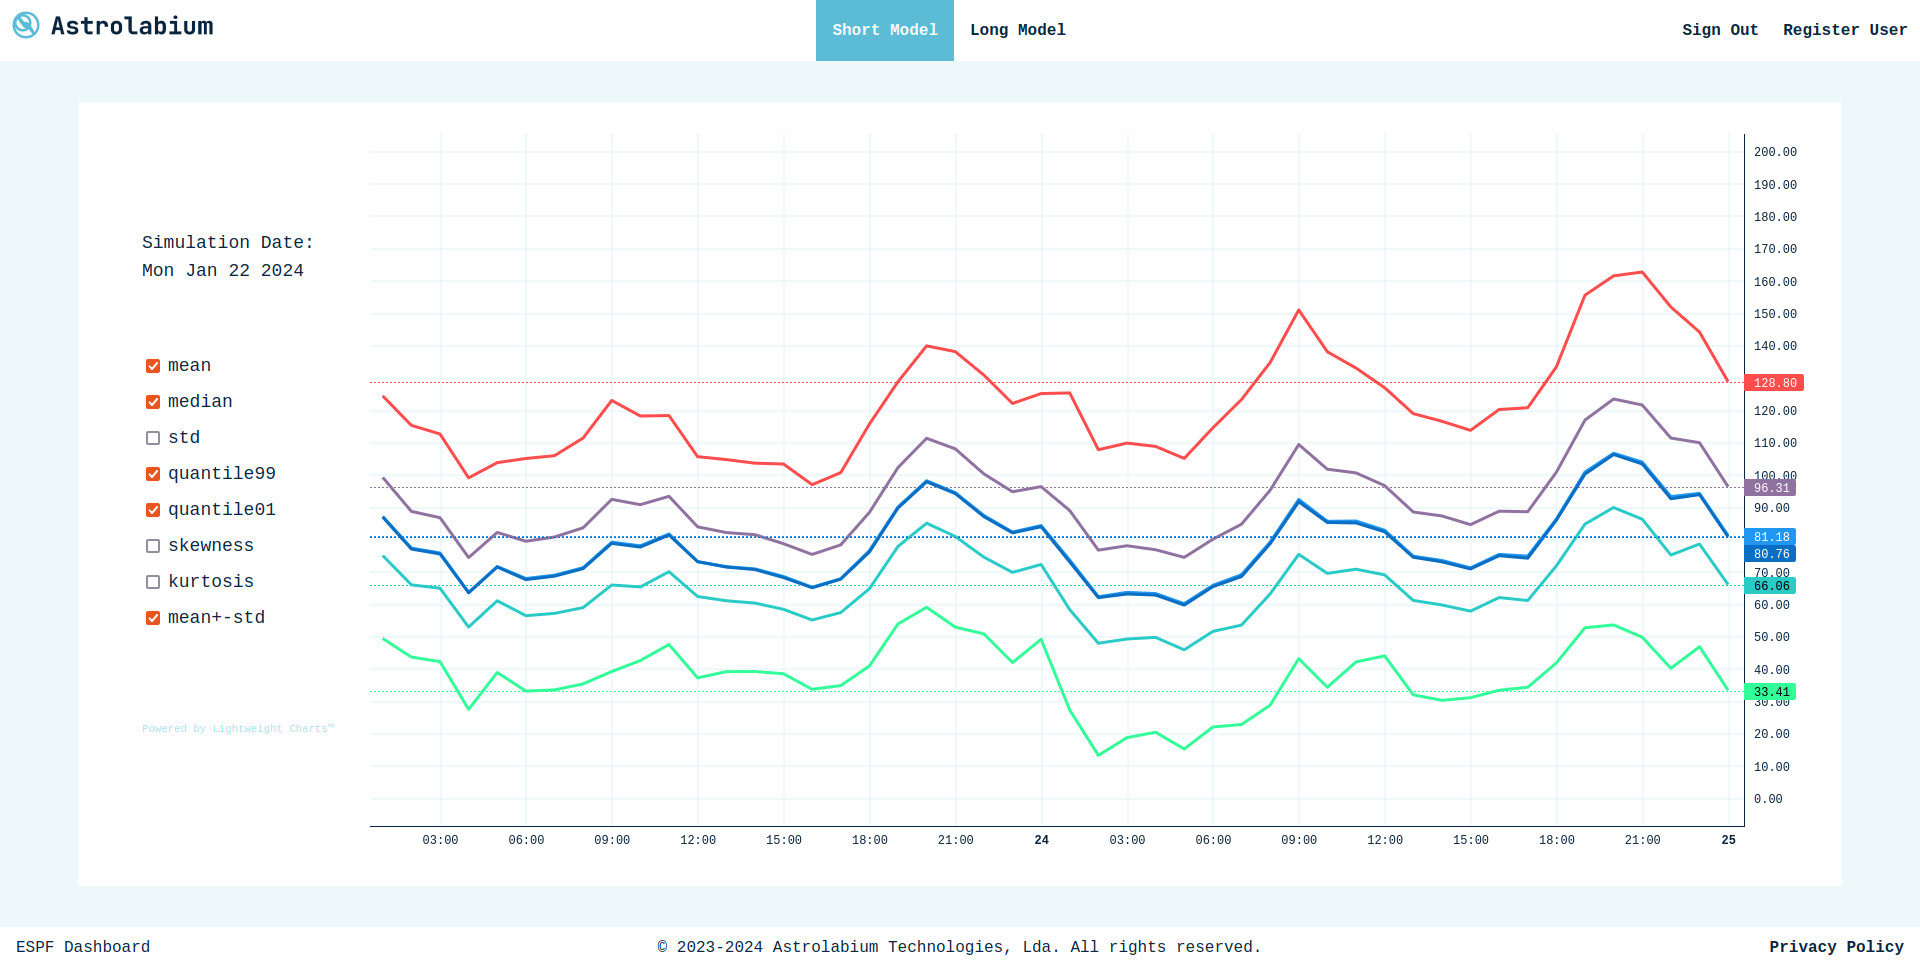
With access to high accuracy predictions, you're able to optimize your bidding strategy in advance. An example: mean and median statistics give you the most likely price value for every time point. These and more are easily accessible in ESPF Dashboard.
Building the probability distribution with the data from ESPF API gives you a thorough understanding of potential price outcomes. You can prepare for likely market trends and determine how flexible you need to be in your trading. An example: calculating the 5% and 95% percentiles allows you to determine the range where a given price will fall with 90% probability.
ESPF Dashboard provides you the daily estimation of core risk metrics for the dates simulated by the Short and Long models, such as the "left" and "right" Value-at-Risk (1% and 99% percentiles). This allows you to provide solid and data-driven reporting to stakeholders with convenience and speed.
An example: using the expected consumption/production curves for your operations and multiplying them by point-by-point with the risk metrics calculated by ESPF, obtaining detailed exposures that correspond to the specific risks in your own operations in addition to market-wide risk.
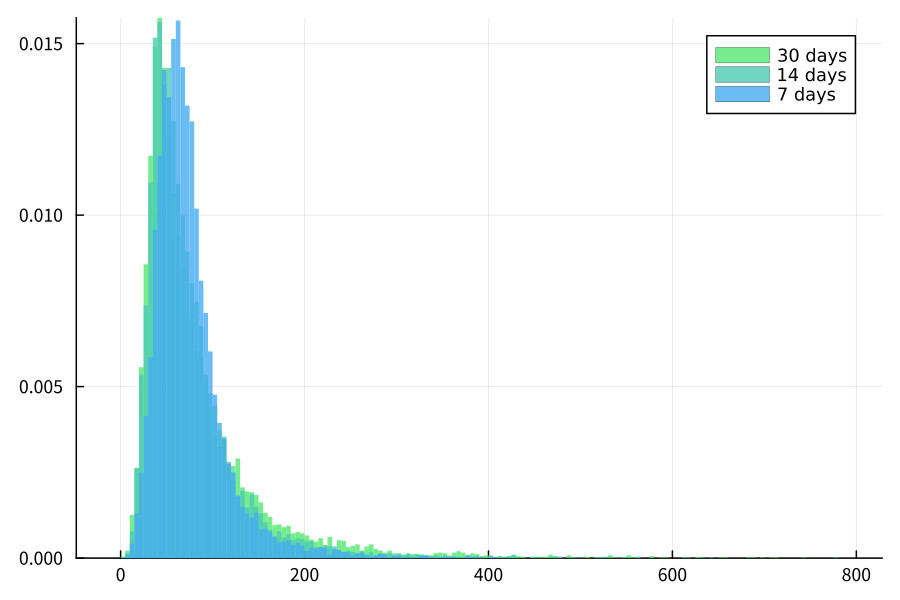
Using the simulation data from ESPF API gives you the ability to calculate 10 000 different future scenarios for portfolios, products or services for the time windows covered by the Short(48 hours) and Long(180 days) models. This way you're able to fully quantify your risk exposure to energy spot price volatility with enough detail to see how the distribution and risk evolve over time.
The ESPF API gives you 10 000 daily simulations of the future spot prices calculated by the Short(48 hours) and Long(180 days) models, amounting to a total of 2 280 000 samples simulated everyday. This depth allows you to increase the detail and impact of your analysis by leveraging new insights into the future values of the spot prices.
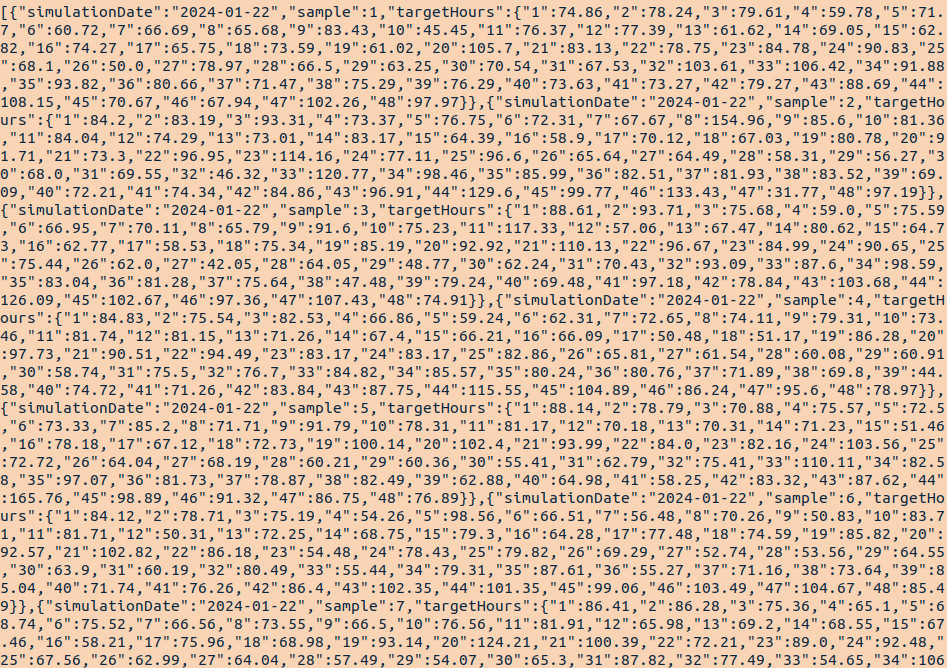
Integrating the service into your analytics workflow is fast and convenient, as all simulations samples are available through a simple API request. You can automate this request so that all data is available at your workstation before you start the daily production. We use a clean JSON format that is easy to parse into your preferred tabular structure.
To handle the volatility of spot prices, you're able to use probabilistic predictions built with the simulation data from ESPF API to optimize your trading strategies and effectively manage exposure to price risks. Even in a context of automated trading, you're able to build probabilistic metrics that can be used to set adaptive floor and ceiling values for your trading algorithms to follow.
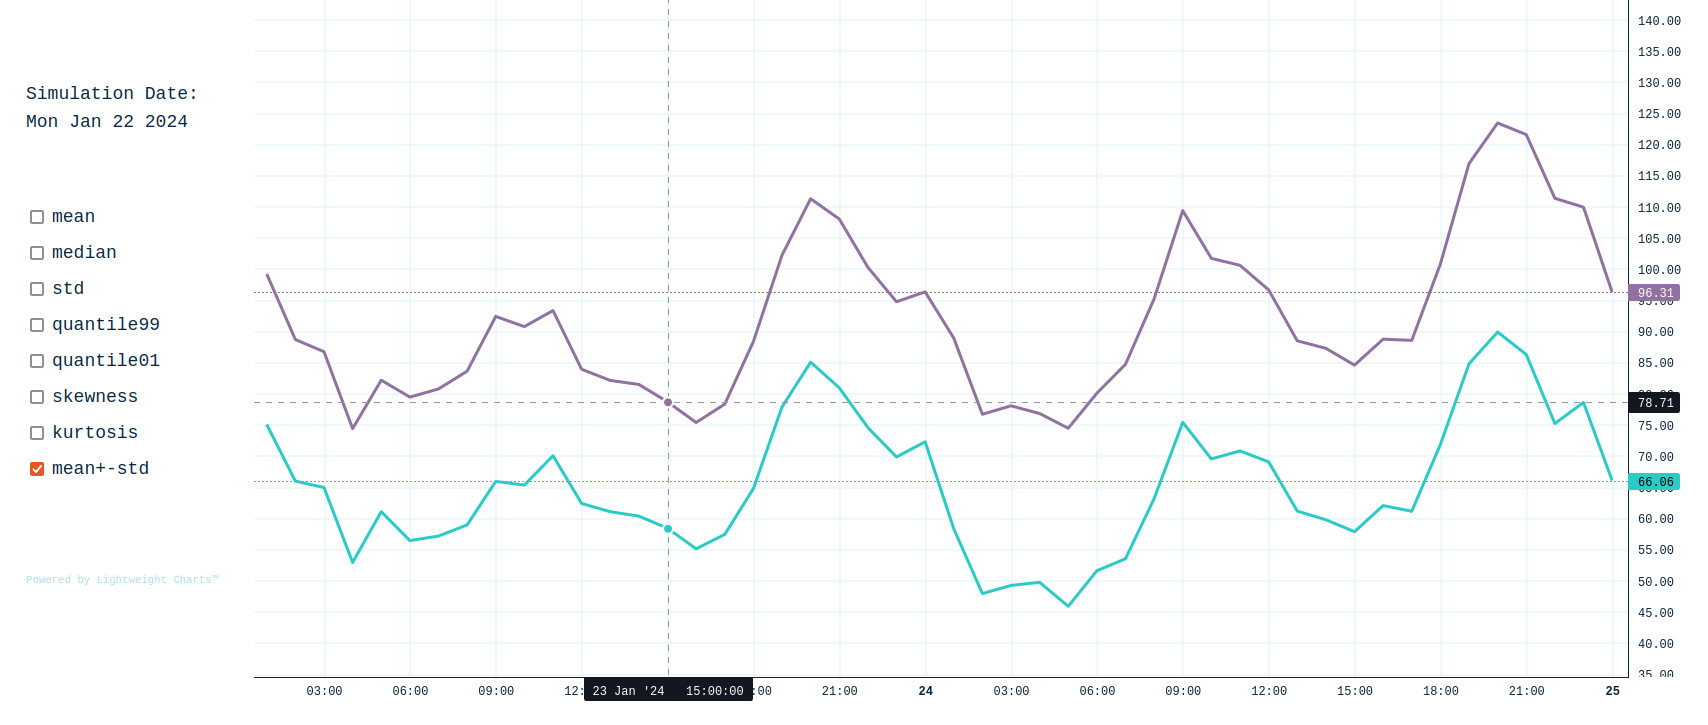
As examples, with algorithms set up for momentum or mean-revertion, you're able to include the mean plus/minus standard deviation as a technical indicator to represent the expected oscillation range of the prices. You're also able to calculate higher quantiles (such as 5% and 95%) as safety floor and ceiling to constrain your losses up to 90% likelihood.
ESPF features two different models for the energy spot prices. This is in order to capture both the short-term price volatility present in the day-to-day auctions and the long-term uncertainty and seasonality patterns. Both models are built with machine-learning and stochastic simulation techniques, but they are unique and reveal different dynamics. As each model is tailored for its specific range, you're able to use the most appropriate forecast for the task at hand.
The Short model focuses on the next 48 hour period, simulating 10 000 different possible prices for each hour. The predictions for the first 24 hour window reveals maximum accuracy, correctly learning daily oscillation patterns, whereas slight more uncertainty is involved with the second 24 hour window; the probability distribution implied by the simulations reflects this accurately by allowing a larger range of prices in the second window.
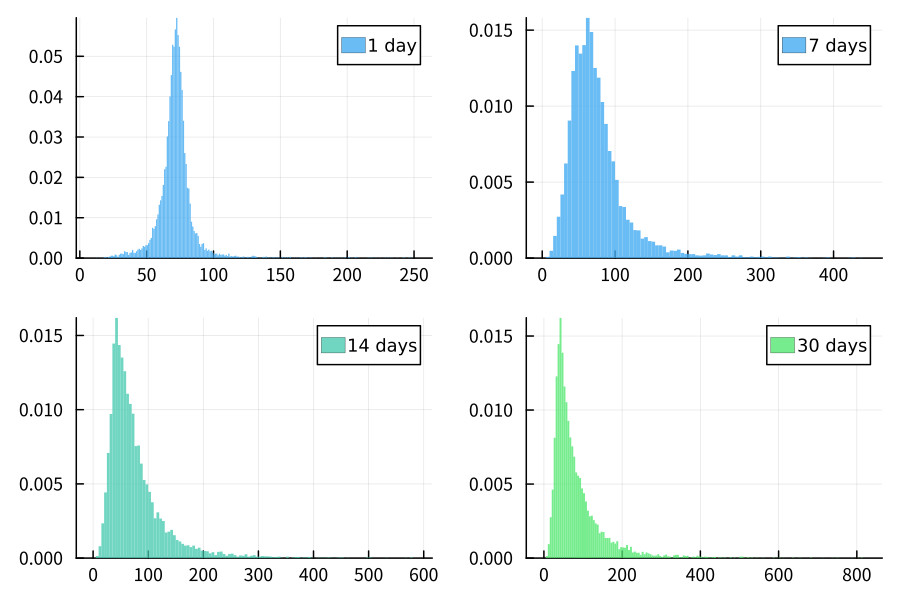
The Long model focuses on the average daily price for the next 180 days, simulating 10 000 different possible values for each day. The model has great accuracy, correctly predicting probabilities of extreme values and learning seasonality patterns. The uncertainty in the predictions increases as we simulate further into the future; the simulations reflect this accurately by allowing greater range of movement as we simulate further into the future.
The ESPF API provides you daily access to 10 000 updated simulations of the price trajectories of the Short and Long models through a RESTful API. Using the data from the previous day, the model engine uses the new information to simulate the future trajectories.
You're able to easily access the data through simple requests to the API. To seamlessly integrate our simulation data into your production pipeline, you can automate the process in any programming language of your choosing.
The ESPF Dashboard is a minimalistic user interface you can access through your web browser to view some core statistics we pre-calculate using the simulation data from ESPF API on a daily basis. It's a quick, easy and convenient way to get basic statistics for decision making.
We provide a 20-day free demo period during which you can try ESPF without limitations.
Contact us to set it up.