Fighting Energy Market Volatility Without a Risk Desk?
You're not alone. PowerNavigator is the AI-powered platform designed for companies like yours, empowering you with the tools to hedge against price risks and to optimize procurement like a major player.
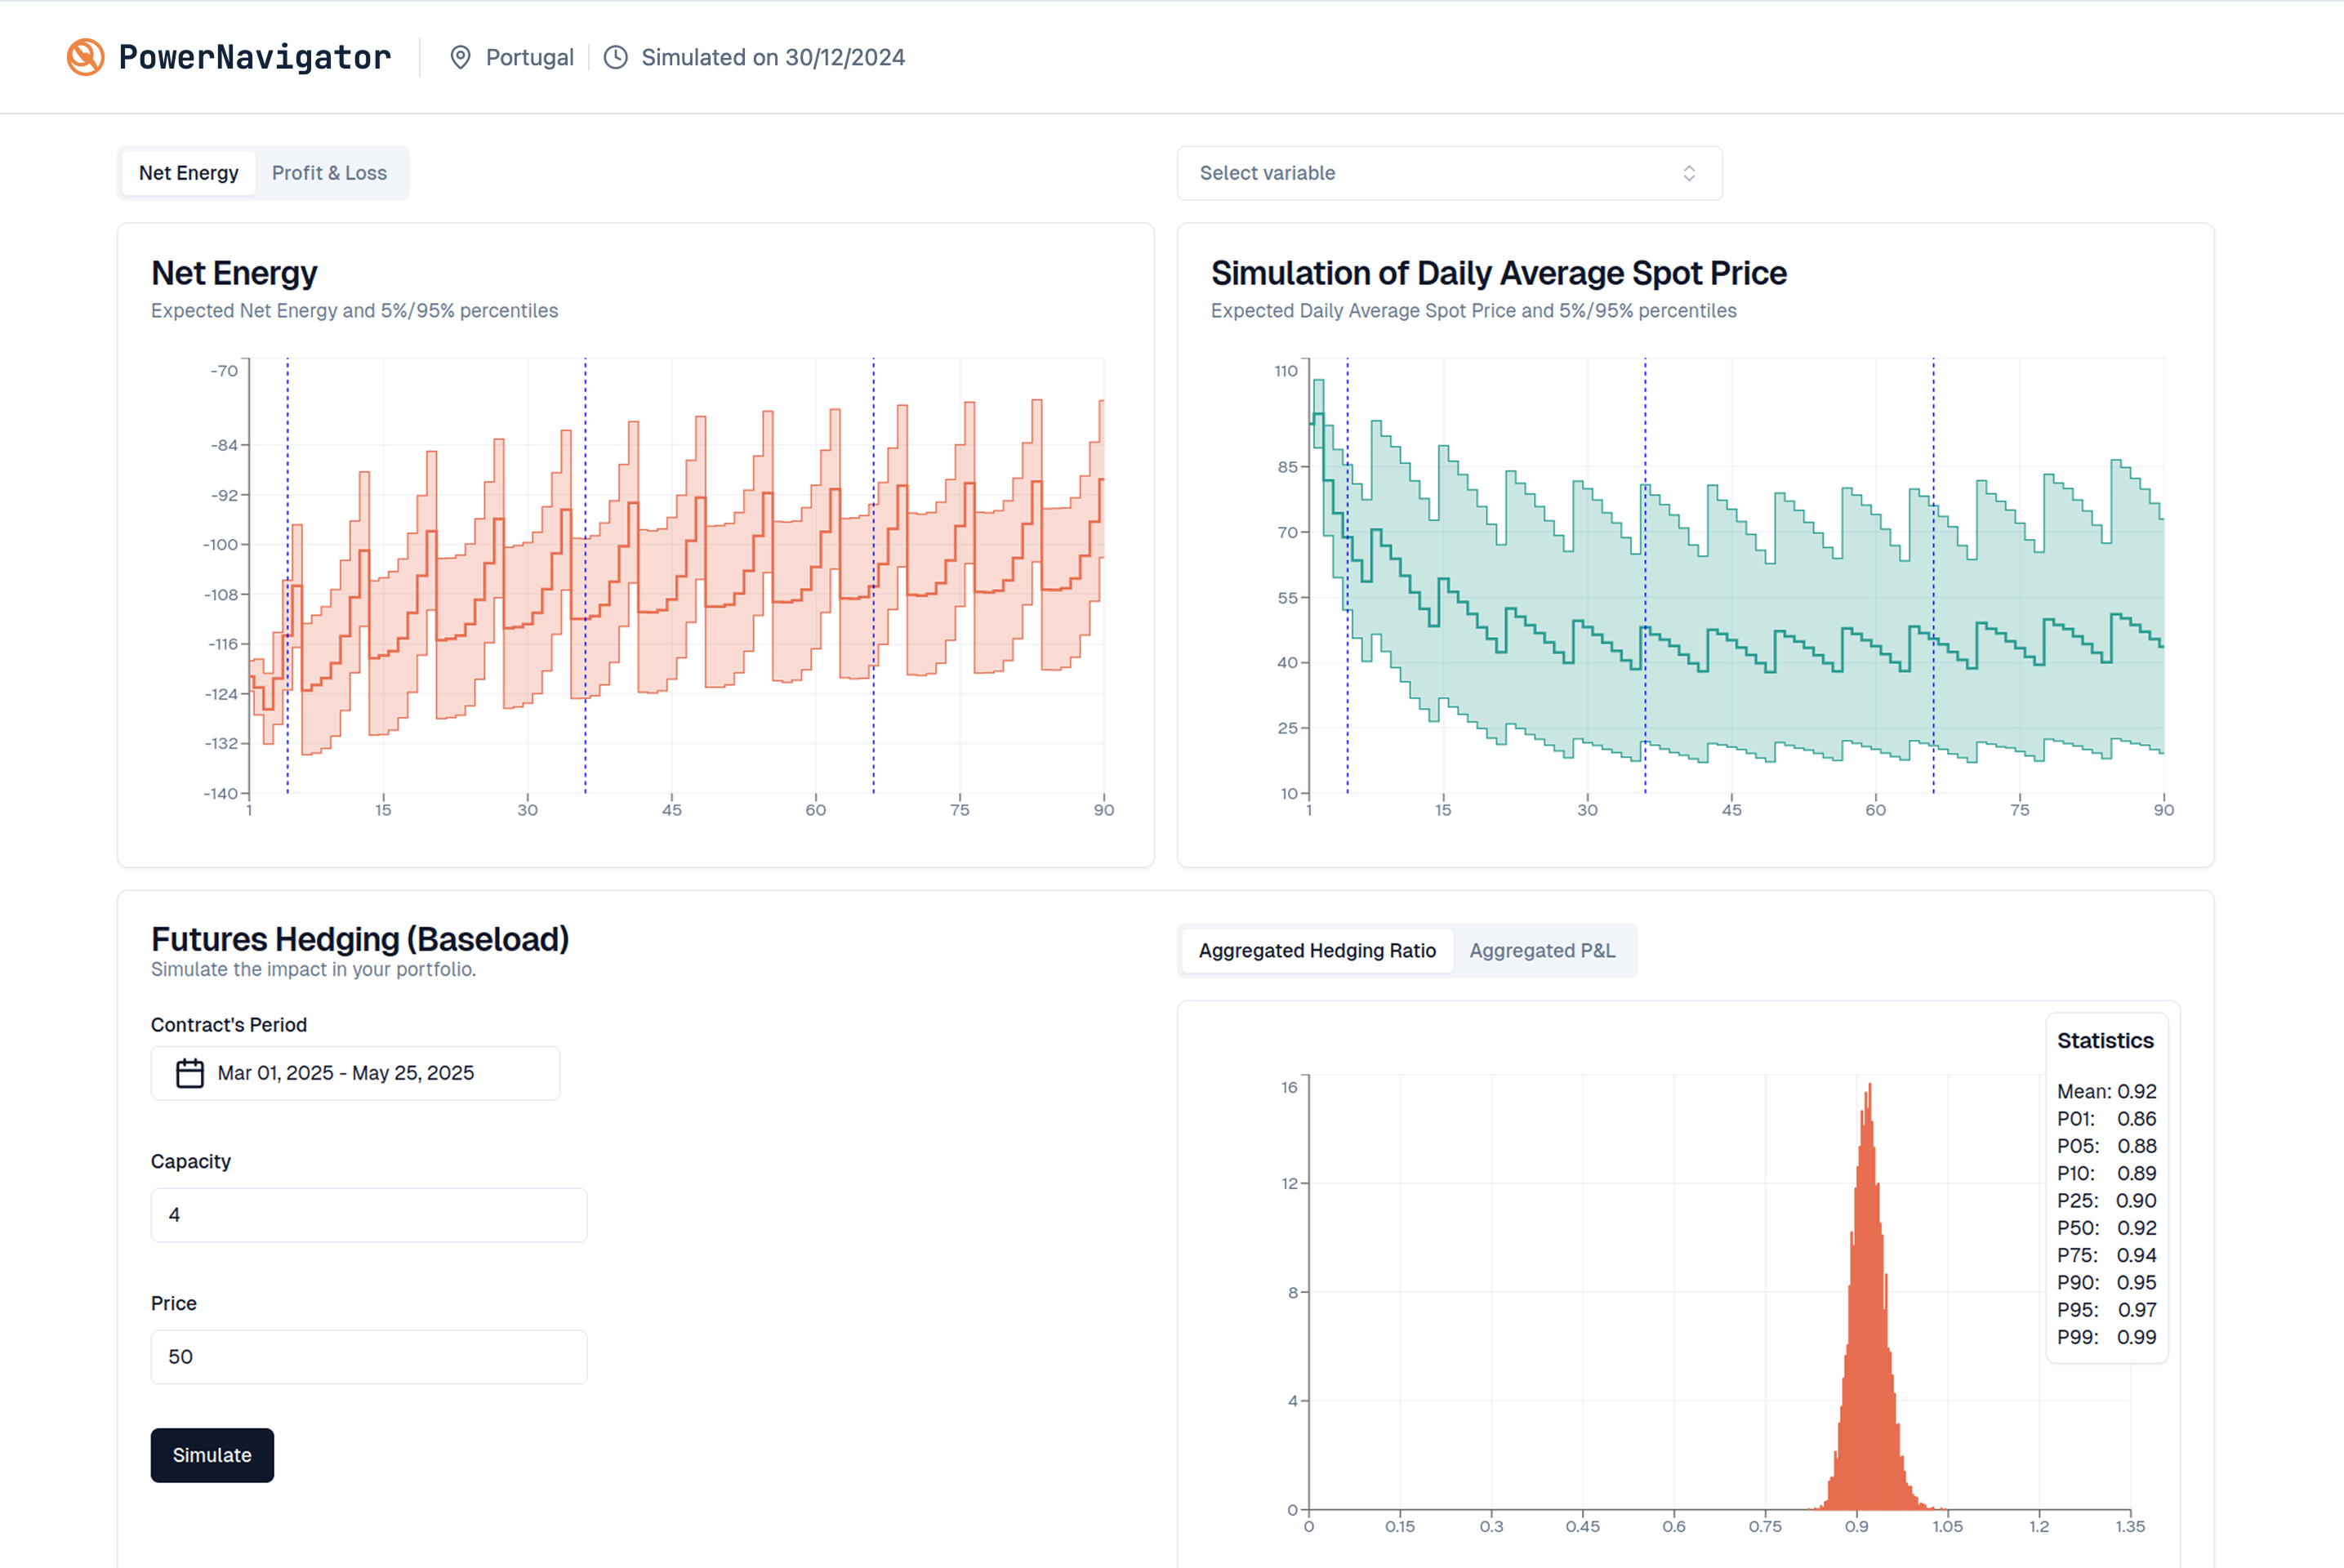
Get to know PowerNavigator
Full Probability Distributions
Understand all possible outcomes for price, grid load, renewables generation and their chances with full probability distributions, not just averages.
Custom Forecasts
We can provide custom forecasts specific to your consumption or production data and integrate it to PowerNavigator
Easy to Use Dashboard & API
Flexible data access via API or easy-to-use dashboards, fitting your existing workflows.
Why Choose Us
Built for Energy Challenges
Proprietary AI Models Tailored for Volatile Energy Markets
For Teams Without a Risk Desk
Designed for Smaller Companies & Industrial Consumers
Always Up to Date
Continuous Model Updates Backed by Research
Full Probability Distribution
Accurate, probabilistic insights that go beyond averages
FAQ
Turn Energy Volatility into Your Advantage
PowerNavigator provides the foresight to make smarter energy trading and procurement decisions, driving down costs and maximizing returns.